Google Cloud Audit Logs: How They Work and Best Practices

Google Cloud Audit Logs: How They Work and Best Practices
Every API call, configuration change, and data access event happening inside your Google Cloud environment leaves a trace, but only if you know where to look. Google Cloud Audit Logs capture that activity automatically, giving you a detailed, timestamped record of who did what, where, and when across your cloud infrastructure.
For teams building healthcare applications or managing sensitive patient data, these logs aren't optional, they're foundational. Regulations like HIPAA require covered entities and their business associates to maintain audit controls that track access to electronic protected health information (ePHI). Without a clear logging strategy, you're flying blind during security incidents and compliance audits alike. At SoFaaS, where we manage SMART on FHIR integrations between third-party applications and EHR systems like Epic and Cerner, audit logging is baked into our HIPAA-compliant and SOC 2 Type II infrastructure precisely because of how critical this visibility is.
This article breaks down how Google Cloud Audit Logs work, from their data structure and log types to how they route through Cloud Logging, and covers the best practices you should follow to get real value from them. Whether you're a software engineer configuring a new project or a CTO evaluating your organization's security posture, you'll walk away with a practical understanding of what these logs capture, why they matter, and how to use them effectively.
Why Google Cloud Audit Logs matter
When something goes wrong in your cloud environment, whether that's an unauthorized access attempt, an unexpected configuration change, or a data exfiltration event, your first question is always "what happened?" Google Cloud Audit Logs give you the evidence trail to answer that question accurately and quickly. Without a reliable record of activity, you're left guessing, and guessing is expensive when sensitive data is involved.
Security incident detection and response
Attackers don't always trigger obvious alarms. A compromised service account might quietly read sensitive data over days or weeks before anyone notices. Audit logs capture every API call and authentication event, so you can spot abnormal patterns like a service account suddenly accessing resources it has never touched, or a user downloading large volumes of data at unusual hours. When you route these logs into a security monitoring tool or configure Cloud Monitoring alerts, you shift from reactive to proactive security.
Detecting a breach in progress is far less damaging than discovering it weeks later, and audit logs are what make real-time detection achievable.
The forensic value of audit logs extends beyond catching active threats. When you need to reconstruct exactly what happened during an incident, a complete, immutable log record lets you trace the sequence of events step by step. This matters equally for internal investigations, law enforcement requests, and cyber insurance claims.
Compliance and regulatory requirements
Compliance frameworks leave little room for interpretation when it comes to logging. HIPAA's Security Rule (45 CFR § 164.312(b)) explicitly requires covered entities and business associates to implement audit controls that record and examine activity in systems containing electronic protected health information (ePHI). If you're building a healthcare application that connects to EHR systems, audit logging isn't a best practice suggestion, it's a legal requirement.
Beyond HIPAA, frameworks like SOC 2 Type II, PCI DSS, and FedRAMP all include logging and monitoring as core controls. Auditors reviewing your environment will ask for evidence that logs are enabled, retained appropriately, and reviewed on a regular basis. Google Cloud Audit Logs provide a structured, tamper-resistant record that satisfies these requirements when you configure them correctly.
Your ability to pass a compliance audit often depends directly on the completeness of your logging setup. Missing logs for a specific resource type or a particular time window create gaps that auditors flag as control failures, even when no actual breach occurred.
Operational accountability
Security and compliance aren't the only reasons to invest in audit logging. On an operational level, knowing who changed a firewall rule, who deleted a Cloud Storage bucket, or who modified an IAM policy is critical for maintaining stability across shared environments. Development, staging, and production environments all benefit from this accountability because it prevents configuration drift and makes it far easier to roll back unintended changes.
Audit logs also support cost and performance investigations. If your cloud spend spikes unexpectedly, the logs can help you identify when a new resource was created, which account created it, and what triggered the change. That operational visibility reduces the time your team spends tracking down the source of problems and strengthens your overall governance posture.
Teams in regulated industries like healthcare, finance, or government find that audit logs become a shared resource across security, engineering, and compliance functions. Rather than maintaining separate tracking systems for each team's needs, a centralized logging strategy built on Google Cloud Audit Logs serves all three groups from a single, consistent source of truth.
Audit log types and what they capture
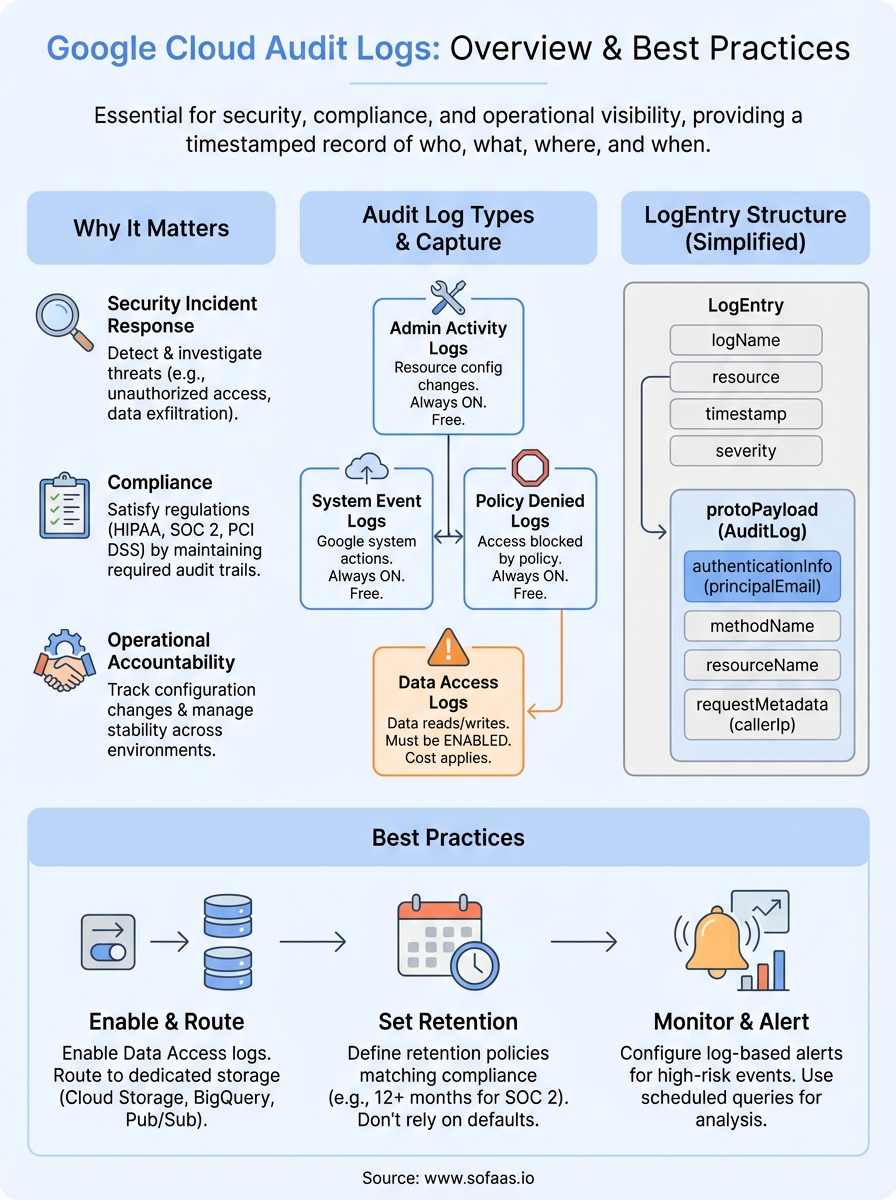
Google Cloud provides four distinct audit log types, and each one captures a different category of activity. Understanding what each type records helps you configure your logging setup correctly and ensures you're not missing critical events in your environment.

Admin Activity logs
Admin Activity audit logs record API calls and administrative actions that modify the configuration or metadata of your resources. This includes creating or deleting a Cloud Storage bucket, changing IAM policies, or modifying a Compute Engine instance. These logs are always enabled by default and cannot be disabled, which means you always have a record of administrative changes regardless of your configuration choices. Google Cloud generates Admin Activity logs at no additional charge, so there's no reason not to route them into your monitoring pipeline.
Because Admin Activity logs are always on, they serve as your baseline safety net for tracking configuration changes across every Google Cloud project.
Data Access logs
Data Access audit logs capture API calls that read resource configurations or metadata, along with user-driven calls that create, modify, or read user-provided data. Unlike Admin Activity logs, these are disabled by default because they can generate high log volumes and incur additional Cloud Logging costs. You need to explicitly enable them for the specific services and access types you want to monitor. For healthcare applications handling ePHI, enabling Data Access logs is essential to satisfy HIPAA audit control requirements, since patient data reads and writes are exactly what these logs track.
Data Access logs come in three subtypes you can enable independently: DATA_READ (reading existing data), DATA_WRITE (creating or modifying data), and ADMIN_READ (reading resource metadata or configuration). That granularity gives you precise control over log volume and cost without sacrificing visibility into the access patterns that matter most.
System Event and Policy Denied logs
System Event audit logs record Google Cloud administrative actions that modify resource configurations, but unlike Admin Activity logs, these originate from Google's own systems rather than direct user actions. A typical example is Compute Engine performing automatic live migration of a virtual machine. System Event logs are always enabled and free of charge.
Policy Denied audit logs capture events where a Google Cloud service denies access to a user or service account because of a security policy violation. These logs are especially useful for identifying misconfigured resources or requests that exceed what your organization's policies permit. Reviewing Policy Denied logs regularly helps you catch both accidental misconfigurations and deliberate attempts to probe your environment's boundaries.
How audit log entries are structured and how to read them
Every entry in Google Cloud Audit Logs follows a standardized format called LogEntry, defined by the Cloud Logging API. That consistent structure means once you understand the fields in one entry, you can read entries across every Google Cloud service without relearning the format. Each LogEntry bundles high-level metadata about the event with a nested payload that holds the specific audit details you need when you're investigating activity or responding to a compliance request.
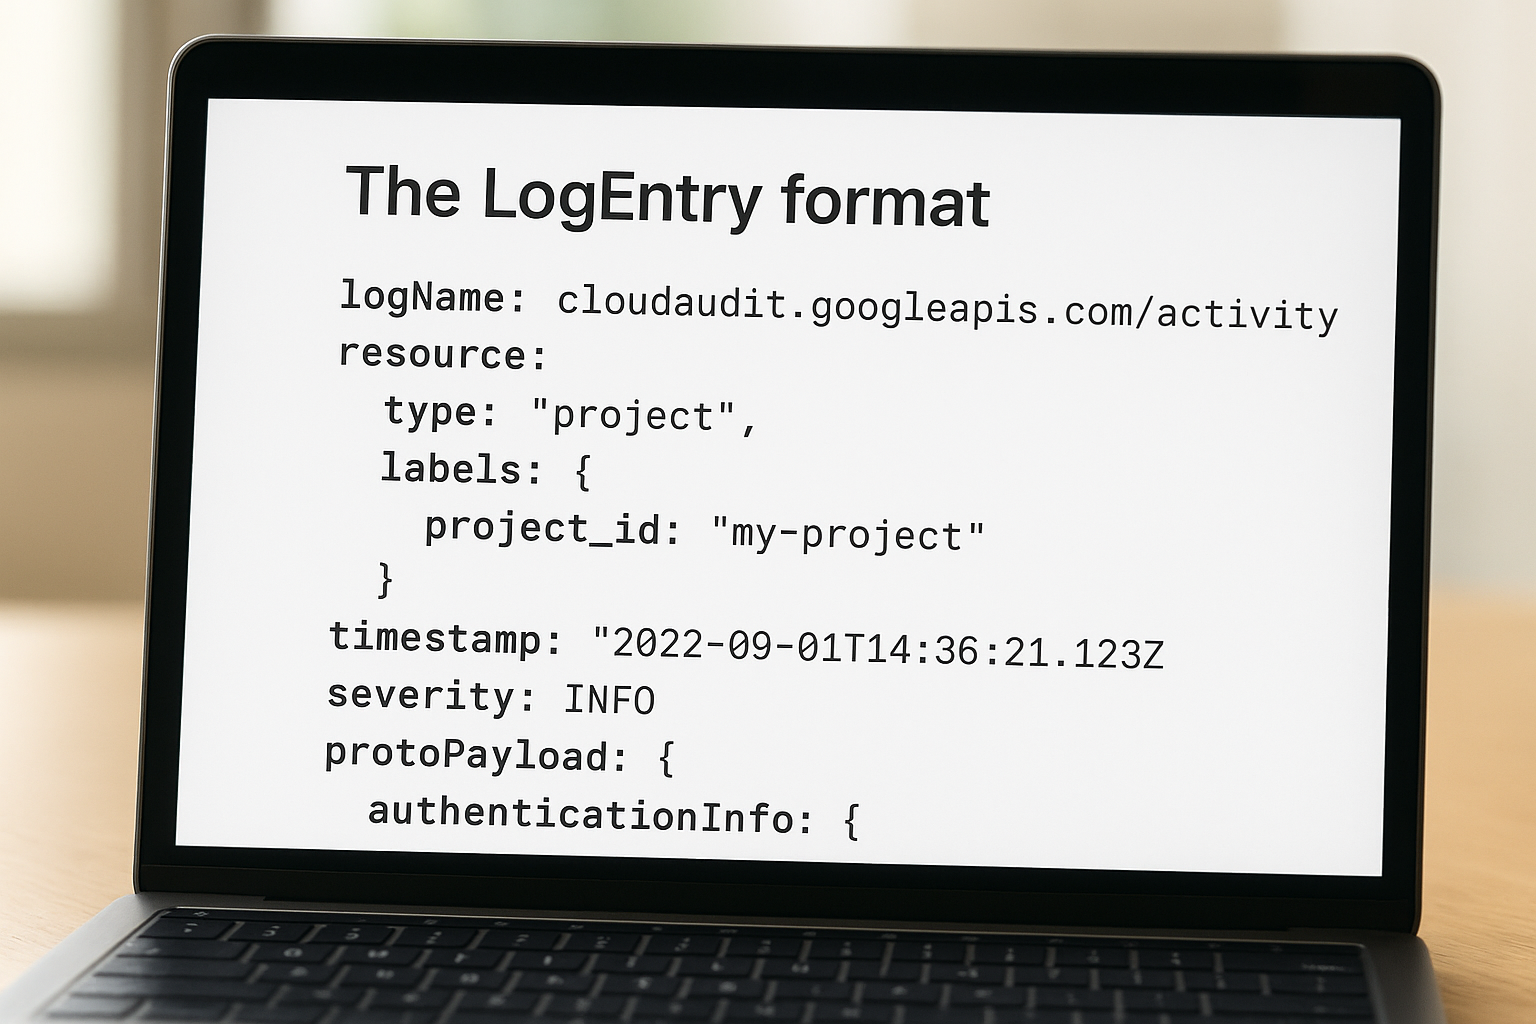
The LogEntry format
The outer LogEntry object carries several fields you'll use constantly. logName identifies which audit log type generated the entry, for example cloudaudit.googleapis.com/activity for Admin Activity logs or cloudaudit.googleapis.com/data_access for Data Access logs. resource describes the Google Cloud resource involved, including its type and labels like project ID or zone. The timestamp field records exactly when the event occurred in UTC, and severity indicates the outcome level, typically INFO for successful operations and ERROR for failures.
| Field | What it tells you |
|---|---|
logName |
Which audit log type generated the entry |
resource |
The service and specific resource affected |
timestamp |
When the event occurred (UTC) |
severity |
Outcome indicator: INFO, WARNING, or ERROR |
protoPayload |
Nested object containing the audit-specific details |
Reading the protoPayload
The protoPayload field is where the most actionable information lives. For audit logs, this payload conforms to the AuditLog type, which contains structured subfields that answer your most immediate investigative questions. authenticationInfo.principalEmail tells you exactly which user or service account triggered the event, making it your first stop when you're tracing suspicious activity back to its source.
The combination of principalEmail, methodName, and resourceName gives you a complete picture of who did what to which resource without needing to pull data from anywhere else.
methodName identifies the specific API operation that was called, such as storage.objects.get for a Cloud Storage read or compute.instances.delete for removing a virtual machine. resourceName provides the full canonical path to the affected resource, and requestMetadata.callerIp records the originating IP address of the request. When you parse these three fields together during a security investigation, you can reconstruct the action with enough context to determine whether it was legitimate or warrants further escalation. Google documents the full AuditLog schema in the Cloud Audit Logs reference, which is worth bookmarking if you work with these entries regularly.
How to enable and configure audit logs
Configuring google cloud audit logs correctly from the start saves you from compliance gaps and incomplete evidence trails later. Admin Activity, System Event, and Policy Denied logs are always on without any action from you, but Data Access logs require explicit configuration at either the project, folder, or organization level. The steps below walk you through the two most common methods for enabling and customizing your audit log setup.
Enabling Data Access logs through the Google Cloud Console
The IAM & Admin section of the Google Cloud Console gives you a visual interface for managing audit log settings without writing any code. Navigate to IAM & Admin > Audit Logs within your project, and you'll see a list of Google Cloud services with checkboxes for each Data Access log subtype: DATA_READ, DATA_WRITE, and ADMIN_READ.
Enabling all three subtypes for services that handle sensitive data, like Cloud Storage, BigQuery, or Cloud Healthcare API, gives you a complete picture of how that data is being accessed and modified.
Select the services you want to monitor, check the relevant subtypes, and click Save. Changes take effect almost immediately. If you're managing multiple projects, setting audit log policies at the organization or folder level is more efficient because those policies cascade down to all projects beneath them, reducing the risk of a misconfigured project slipping through.
Configuring audit logs with the gcloud CLI or Terraform
For teams that manage infrastructure as code, the gcloud CLI and Terraform both support programmatic audit log configuration, which fits naturally into your existing deployment pipelines. Using the gcloud CLI, you can update a project's IAM policy to include an auditConfigs block that specifies which services and log types to enable. The Google Cloud IAM documentation provides the exact JSON and YAML syntax for constructing these policy updates.
With Terraform's google_project_iam_audit_config resource, you can declare your audit log settings alongside the rest of your infrastructure definitions, version them in source control, and apply them consistently across environments. This approach eliminates manual configuration steps that are easy to miss during project creation. Whether you choose the Console, gcloud, or Terraform, you should verify your configuration by generating a test event in the target service and confirming the corresponding log entry appears in Cloud Logging's Logs Explorer before relying on the setup for compliance or security monitoring purposes.
Best practices for storage, retention, and monitoring
Collecting google cloud audit logs is only half the work. How you store, retain, and monitor those logs determines whether they actually protect your organization when a security incident occurs or a compliance auditor asks for evidence. A few deliberate configuration choices make the difference between a logging setup that holds up under scrutiny and one that fails you at the worst possible moment.
Route logs to a dedicated storage sink
By default, Cloud Logging retains audit logs for a limited period within the _Default log bucket, but relying on that default is a risk you should not take. Cloud Logging sinks let you export copies of your audit logs to destinations you control, including Cloud Storage buckets, BigQuery datasets, and Pub/Sub topics. Routing logs to a dedicated sink separates your audit data from general operational logs and makes it significantly easier to query, archive, and retrieve entries during an investigation.
Sending logs to a Cloud Storage bucket with Object Versioning enabled protects your audit records from accidental deletion or modification, reinforcing their integrity as evidence.
Consider which destinations serve your different use cases:
- Cloud Storage: Low-cost, long-term archival for compliance retention requirements
- BigQuery: Structured querying for security analysis and trend reporting
- Pub/Sub: Real-time streaming to external SIEM systems or alerting pipelines
Set retention policies that match your compliance requirements
Cloud Logging's default retention period is 400 days for Admin Activity logs and 30 days for Data Access logs within the _Default bucket. For most regulated industries, 30 days is far too short. HIPAA recommends retaining audit records for a minimum of six years, and SOC 2 auditors typically expect at least 12 months of log history to be immediately accessible during a review period.
Configure custom retention directly on your Cloud Logging buckets, and use a Cloud Storage sink with lifecycle rules to move older logs to Nearline or Coldline storage, which reduces cost while keeping records retrievable. Document your retention policy in writing and align it with the specific regulatory frameworks your organization operates under.
Monitor logs with alerts and scheduled queries
Cloud Monitoring log-based alerts let you trigger notifications the moment a specific pattern appears in your audit logs, such as an IAM policy change, a bucket permission update, or a failed authentication attempt from an unexpected IP address. Setting up alerts for your highest-risk event types shifts your team from manual log review to automated detection.
Scheduled queries in BigQuery complement real-time alerts by surfacing patterns that only become visible over time, like a service account gradually expanding its resource access across weeks. Running weekly or monthly queries against your exported audit log data gives your security and compliance teams a structured review cadence without requiring manual log inspection.
Final takeaways
Google cloud audit logs give you a structured, tamper-resistant record of every significant action across your cloud environment, from admin configuration changes to individual data access events. Getting value from them requires more than just enabling the defaults. You need to explicitly turn on Data Access logs for services handling sensitive data, export logs to dedicated sinks, set retention periods that match your regulatory requirements, and configure alerts for your highest-risk event types.
For teams building healthcare applications, these practices are not optional extras. HIPAA audit control requirements, SOC 2 Type II reviews, and security incident investigations all depend on having complete, accessible log records that you can retrieve and analyze quickly. The investment in a solid logging configuration pays off every time an auditor asks for evidence or a security alert fires.
If your application connects to EHR systems and you need HIPAA-compliant infrastructure with audit logging built in, explore what SoFaaS SMART on FHIR integration offers.
The Future of Patient Logistics
Exploring the future of all things related to patient logistics, technology and how AI is going to re-shape the way we deliver care.
Thank you! Your submission has been received!
Oops! Something went wrong while submitting the form.