Azure Monitor Audit Logs: How To Access, Query, Analyze

Every action taken across your Azure environment, user sign-ins, permission changes, resource modifications, gets recorded. Azure Monitor audit logs give you a structured way to access, query, and analyze those records so you can answer critical questions about who did what, when, and where in your infrastructure.
For teams building healthcare applications, this isn't optional. HIPAA requires detailed audit trails, and regulations like SOC 2 Type II demand proof that you're actively monitoring access to sensitive data. At SoFaaS, we built our managed SMART on FHIR platform on HIPAA and SOC 2 Type II compliant infrastructure specifically because healthcare integrations need this level of accountability baked in from day one.
Whether you're tracking user activity for a compliance audit, investigating a security incident, or simply trying to understand how your Azure resources are being used, you need to know how audit logs work and how to get actionable data out of them. This article breaks down the differences between Azure log types, walks you through accessing and querying audit logs, and shows you how to turn raw log data into meaningful insights for your organization.
Why Azure Monitor audit logs matter
When something goes wrong in your Azure environment, the first question your team asks is "what changed?" Azure Monitor audit logs answer that question with a time-stamped, structured record of every control-plane operation across your subscriptions. Without them, you're left reconstructing events from memory or incomplete sources, which is both slow and unreliable. Having these logs in place means your team can move from confusion to answers in minutes, not days.
Audit logs are not just a compliance checkbox. They are the primary tool your team uses to investigate incidents, verify changes, and demonstrate accountability.
Security visibility you can act on
Security incidents rarely announce themselves clearly. Most of the time, suspicious activity looks exactly like normal operations until you examine the pattern. Audit logs give you the raw material to spot those patterns, whether that's an unexpected permission escalation, a configuration change made outside business hours, or a service principal accessing resources it shouldn't touch. You can set up alerts in Azure Monitor to fire the moment a specific event appears in your logs, which shortens your response window significantly.
Regular review of audit log data also helps you identify security posture drift. Over time, configurations change, accounts accumulate permissions they no longer need, and access policies loosen. Proactive log analysis lets you catch these issues before they become incidents, rather than discovering them during a post-mortem. Consistent review habits are what separate teams that stay ahead of threats from those that react to them.
Compliance requires documented evidence
Regulatory frameworks don't just require you to have security controls in place. They require you to prove those controls are working. HIPAA, SOC 2 Type II, and similar standards explicitly ask for audit trail documentation covering who accessed what data and when. If your organization handles protected health information or sensitive financial data, your auditors will want to see log evidence, not just a policy document.
Azure Monitor gives you the infrastructure to collect and retain that evidence. You can export logs to long-term storage, run structured queries to produce compliance reports, and build dashboards that show auditors exactly what they need. That kind of documented visibility is what separates organizations that pass audits cleanly from those that scramble to gather evidence at the last minute.
What counts as an audit log in Azure
Not everything Azure Monitor collects qualifies as an audit log. Azure separates its logging into several distinct categories, and understanding those categories helps you collect the right data for the right purpose. The two types you'll encounter most often are Activity Logs and resource-level diagnostic logs, and they serve different functions even though they both live inside the same monitoring platform.
Activity Logs versus resource diagnostic logs
Activity Logs capture control-plane operations: creating a virtual machine, modifying a network security group, or assigning a role to a user. These records tell you who made a structural change to your Azure resources and when. They're tenant-wide by default and retained for 90 days in Azure Monitor before you need to configure additional storage.
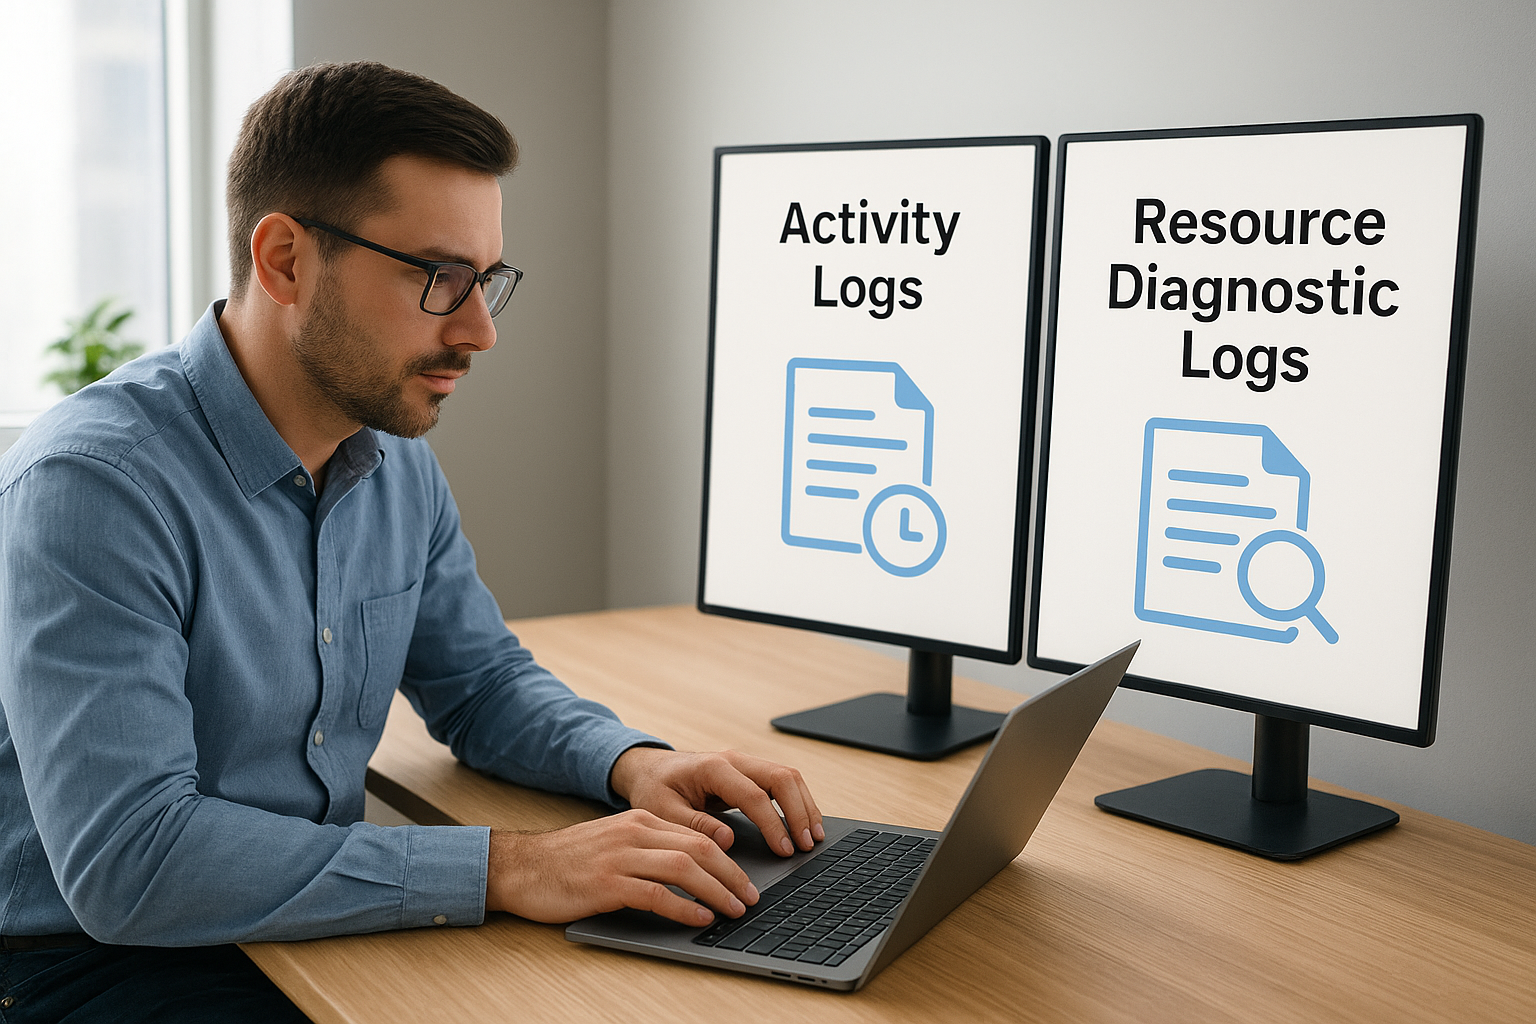
Resource diagnostic logs go deeper, recording data-plane events inside a specific service, which is what compliance-focused teams typically need most.
Resource diagnostic logs are generated by individual Azure services, such as Microsoft Entra ID sign-in logs, Azure Key Vault access records, and storage account transaction logs. These logs track what happened inside a resource, not just to it. When you build azure monitor audit logs workflows for HIPAA or SOC 2 compliance, you'll pull from both sources to construct a full picture of activity across your environment.
Microsoft Entra ID audit logs
Microsoft Entra ID produces its own dedicated audit log stream that records identity-level events: user creation, group membership changes, and application permission grants. These logs are separate from your subscription Activity Logs but just as important, especially if you need to document access control decisions for a regulatory audit.
How to access audit logs in Azure Monitor
You have several paths to reach your azure monitor audit logs, depending on what you're investigating and how you prefer to work. The fastest starting point for most teams is the Azure portal, which gives you a visual interface without requiring any query syntax upfront.
Using the Azure portal
Log in to the Azure portal and navigate to Monitor in the left-hand menu. From there, select "Activity log" to see control-plane events across your subscription. You can filter by timeframe, resource group, operation type, and caller identity to narrow your results quickly. For resource-level diagnostic logs, open the specific resource you want to inspect, select "Diagnostic settings," and confirm that logs are being routed to a Log Analytics workspace or storage account.
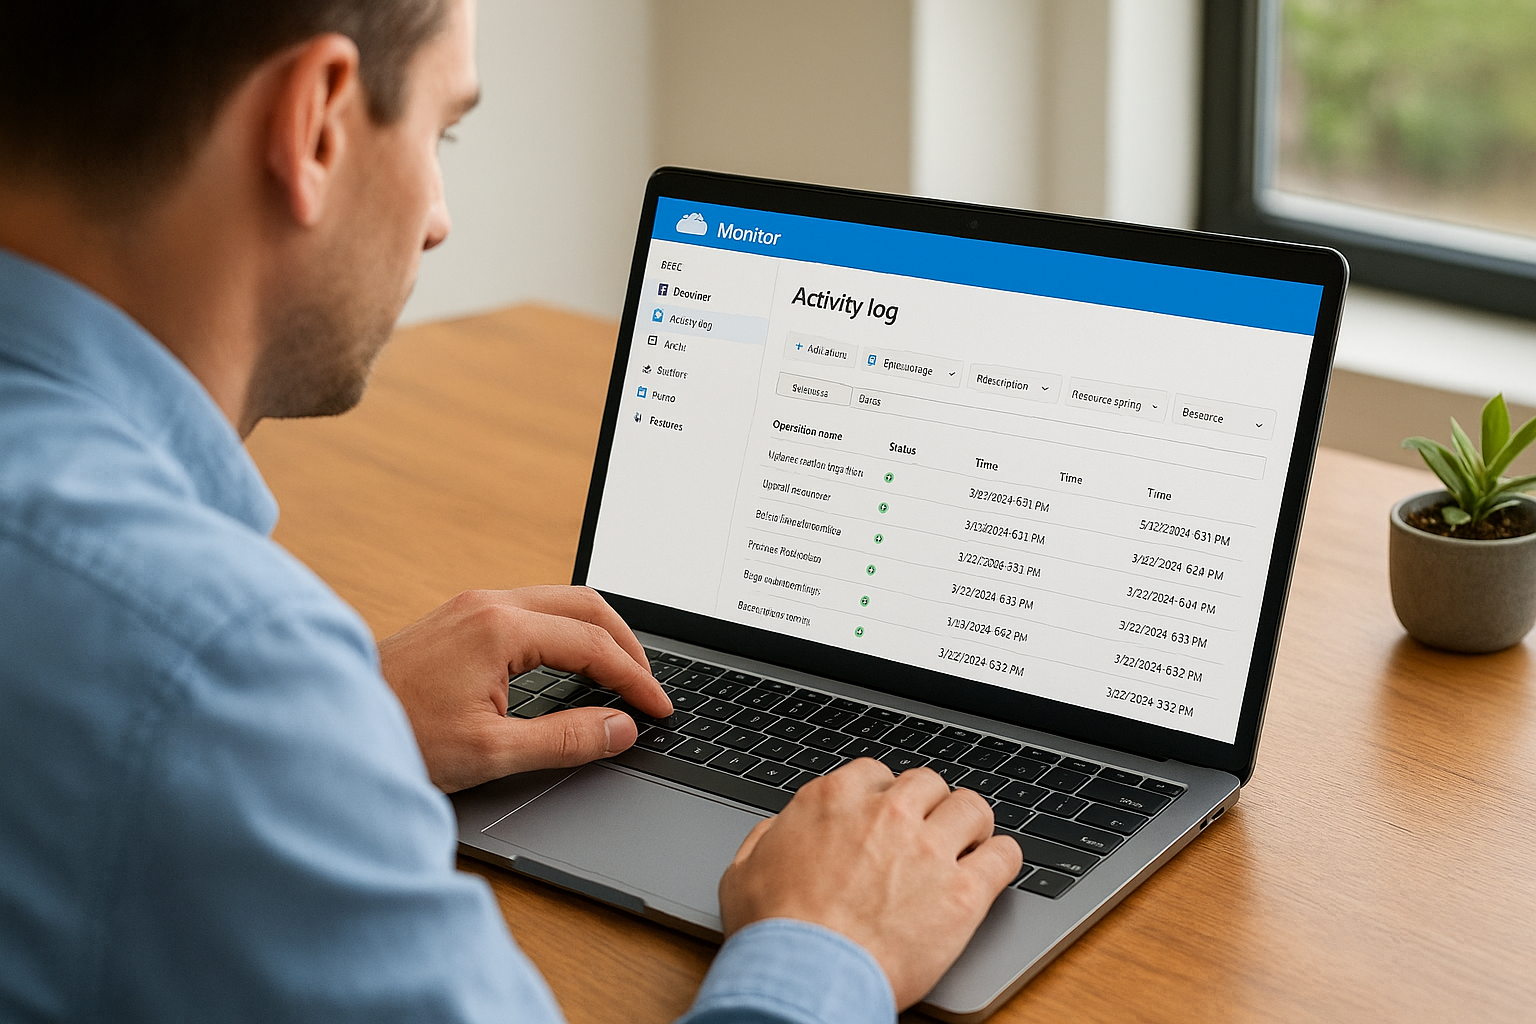
If diagnostic settings are not configured on a resource, Azure is not collecting that resource's logs at all, which is a gap you need to close before any compliance audit.
Accessing logs through Log Analytics
Once you route logs to a Log Analytics workspace, you unlock much more powerful access options. Inside the Azure portal, navigate to your workspace and open Logs to run queries directly against collected data. This workspace becomes the central hub where Activity Logs, Microsoft Entra ID audit logs, and resource diagnostic logs all land together.
You can also access your Log Analytics workspace programmatically through the Azure Monitor REST API or via the Azure CLI, which lets you pull log data into custom dashboards, scripts, or external reporting tools without touching the portal at all.
How to query and analyze audit logs with KQL
Once your logs land in a Log Analytics workspace, Kusto Query Language (KQL) is how you pull meaningful information out of them. KQL is the query language built into Azure Monitor, and it's designed to filter, aggregate, and correlate large volumes of log data quickly. You don't need to be an expert to get started, but a few core patterns will cover most of your audit log analysis needs.
Writing your first audit log query
The AzureActivity table holds your Activity Log records, and it's usually the first place you'll query when investigating a change. A basic query looks like this:
AzureActivity
| where TimeGenerated > ago(7d)
| where OperationNameValue contains "write"
| project TimeGenerated, Caller, OperationNameValue, ResourceGroup, ActivityStatusValue
| order by TimeGenerated desc
This query returns all write operations from the past seven days, sorted newest first. The project operator limits output to the columns you actually need, which keeps results readable and reduces noise in your output.
Filtering for security-relevant events
When you use azure monitor audit logs for compliance or incident response, you'll often filter by caller identity or specific operation types. Adding | where Caller == "user@domain.com" isolates activity from a single account, while filtering on ActivityStatusValue == "Failure" surfaces denied or failed operations that may indicate unauthorized access attempts.
Combining caller filters with time-range filters lets you reconstruct exactly what a specific identity did during a defined window, which is precisely what auditors ask for.
Common filters to keep on hand for security reviews include:
Callerto isolate a specific user or service principalResourceGroupto scope activity to a single workloadOperationNameValueto target specific action types like role assignments
Retention, export, and alerting best practices
Raw log collection is only useful if you retain data long enough to act on it and route it to the right places. Azure Monitor audit logs default to a 90-day retention window in Log Analytics, but most compliance frameworks require you to keep records for one to three years minimum, so you need to configure longer retention or external archiving from the start.
Setting retention policies
You can extend retention directly inside your Log Analytics workspace by adjusting the data retention setting under Usage and Estimated Costs in the Azure portal. Microsoft allows workspace-level retention up to 730 days, after which you need a separate archival strategy to meet longer regulatory requirements.
Locking in your retention policy before a compliance audit is due is the difference between passing cleanly and scrambling to reconstruct missing records.
Exporting logs for long-term storage
For storage beyond workspace limits, configure Azure Monitor Diagnostic Settings to stream logs to an Azure Storage Account or an Event Hub. Storage accounts give you cost-effective archiving with immutable blob storage options that prevent tampering, which auditors value highly. Event Hub export lets you forward log data to a SIEM like Microsoft Sentinel for deeper correlation and analysis.
Configuring alerts on audit events
Set up Azure Monitor alert rules that trigger on specific audit log events rather than reviewing logs manually on a schedule. Target high-priority conditions like role assignment changes or failed authentication spikes using a Log Analytics scheduled query rule. Routing those alerts to an Action Group ensures the right person gets notified immediately, not hours later.

Wrap up and what to do next
Azure monitor audit logs give you the visibility you need to stay on top of security, compliance, and operational changes across your Azure environment. You now know how to distinguish Activity Logs from resource diagnostic logs, access and query log data using KQL, configure retention for long-term regulatory requirements, and set up alerts that surface critical events as they happen. Each of those steps builds on the last, so start with routing logs to a Log Analytics workspace and work outward from there.
For teams building healthcare applications, this level of documented accountability is non-negotiable. Compliance frameworks like HIPAA and SOC 2 Type II require proof, not just policy. If you're also dealing with EHR integrations and want compliant infrastructure handled for you from day one, explore how SoFaaS simplifies SMART on FHIR integration so your team can focus on building rather than maintaining compliance plumbing.
The Future of Patient Logistics
Exploring the future of all things related to patient logistics, technology and how AI is going to re-shape the way we deliver care.
Thank you! Your submission has been received!
Oops! Something went wrong while submitting the form.