Datadog Audit Logs: Audit Trail, Streaming, And Analysis

Every action taken inside your infrastructure, who accessed what, when, and why, matters when you're operating under strict compliance requirements like HIPAA or SOC 2. Datadog audit logs give engineering and security teams a concrete way to track internal user activity, monitor configuration changes, and feed that data into broader security and compliance workflows.
For teams building healthcare applications, audit logging isn't optional. It's a baseline requirement. At SoFaaS, we build managed SMART on FHIR integration infrastructure with built-in compliance controls, including audit logging and encryption, so healthcare innovators don't have to piece that together from scratch. But the platforms and tools surrounding your integration layer, like Datadog, need the same level of visibility and accountability to keep your entire stack audit-ready.
This article breaks down how Datadog's Audit Trail feature works, how to stream and ingest audit logs from external platforms, and how to analyze that data effectively for security and compliance. Whether you're monitoring access to production environments or building dashboards for your compliance team, you'll walk away with a clear understanding of what Datadog offers and how to put it to work.
What Datadog audit logs include
Datadog captures two distinct categories of audit data, and understanding both helps you build a complete picture of what's happening inside your stack. The first category covers activity within the Datadog platform itself, meaning actions your team members take inside Datadog. The second covers log data you pull in from external systems, such as cloud providers or application services, so you can analyze them alongside your Datadog telemetry.
User and administrative activity
When you turn on Datadog's Audit Trail, it records every significant action performed by users inside your Datadog account. That includes login events and session activity, changes to dashboards and monitors, modifications to alert policies, API key creation or revocation, and role-based access control updates.
Every role change or API key event is captured with a timestamp, the user who triggered it, and the originating IP address, giving you the exact context you need for an investigation.
This level of detail is particularly useful when you need to prove, during a compliance audit, that only authorized personnel accessed sensitive configuration settings. You can filter these events by user, event type, or time range directly inside the Audit Trail interface without writing any queries.
Configuration changes and API access
Beyond user logins, Datadog tracks infrastructure configuration changes made through the UI or via the API. If someone updates an integration setting, modifies a log pipeline, or changes a notification channel, Audit Trail records it. This applies whether the change was made by a human or an automated process using a service account.
For teams managing multi-environment deployments, this matters a lot. A misconfigured log pipeline in production can silently drop critical events, and without an audit record of who changed it and when, root cause analysis becomes guesswork. Datadog's audit logs give you a reliable record of those changes so you can trace configuration drift back to its source quickly.
Why audit logs matter for security and compliance
When a security incident happens or an auditor requests evidence, you need concrete, timestamped records of who did what and when. Without that data, you're left guessing. Audit logs convert that uncertainty into verifiable facts that protect both your team and your organization.
Satisfying HIPAA and SOC 2 requirements
Regulatory frameworks like HIPAA and SOC 2 Type II don't just recommend audit logging, they require it. HIPAA's Security Rule mandates activity monitoring for systems that store or transmit protected health information (PHI), and SOC 2 auditors expect documented evidence that access to sensitive systems is being tracked continuously.
Audit logs are not a compliance checkbox. They're the primary evidence your auditors will examine to confirm that your access controls are working as intended.
Your compliance posture strengthens significantly when you can produce a filtered audit trail on demand. Instead of scrambling to gather evidence after an audit request, you pull a pre-filtered report directly from your logging system and hand it to your auditors without delay.
Reducing your response time to incidents
Using datadog audit logs alongside your standard monitoring shortens the gap between spotting an anomaly and confirming what caused it. When a configuration changes unexpectedly or an API key gets created without a corresponding ticket, your team pulls the relevant audit event in seconds rather than hours.
Precise incident response depends on accurate data. You stop reconstructing events from memory and start working from a verified, sequential record of exactly what happened.
How Datadog Audit Trail works
Datadog's Audit Trail is a dedicated feature within the Datadog platform that records and stores account-level events separately from your standard log management pipeline. You enable it at the organization level, and once active, it begins capturing user and configuration events automatically without requiring custom instrumentation or additional agents.
Enabling and configuring Audit Trail
You turn on Audit Trail through your Datadog organization settings, under the Security section. From there, you set a retention period for audit events, currently ranging from 7 to 90 days depending on your plan.
Once enabled, all captured events are immediately accessible through the Audit Trail explorer, where you can search, filter, and export records as needed without touching your standard log pipeline configuration.
Navigating the Audit Trail explorer
The Audit Trail explorer gives you a searchable interface for reviewing every recorded event. You can filter by user, event type, or asset type, and each result loads instantly without running complex queries.
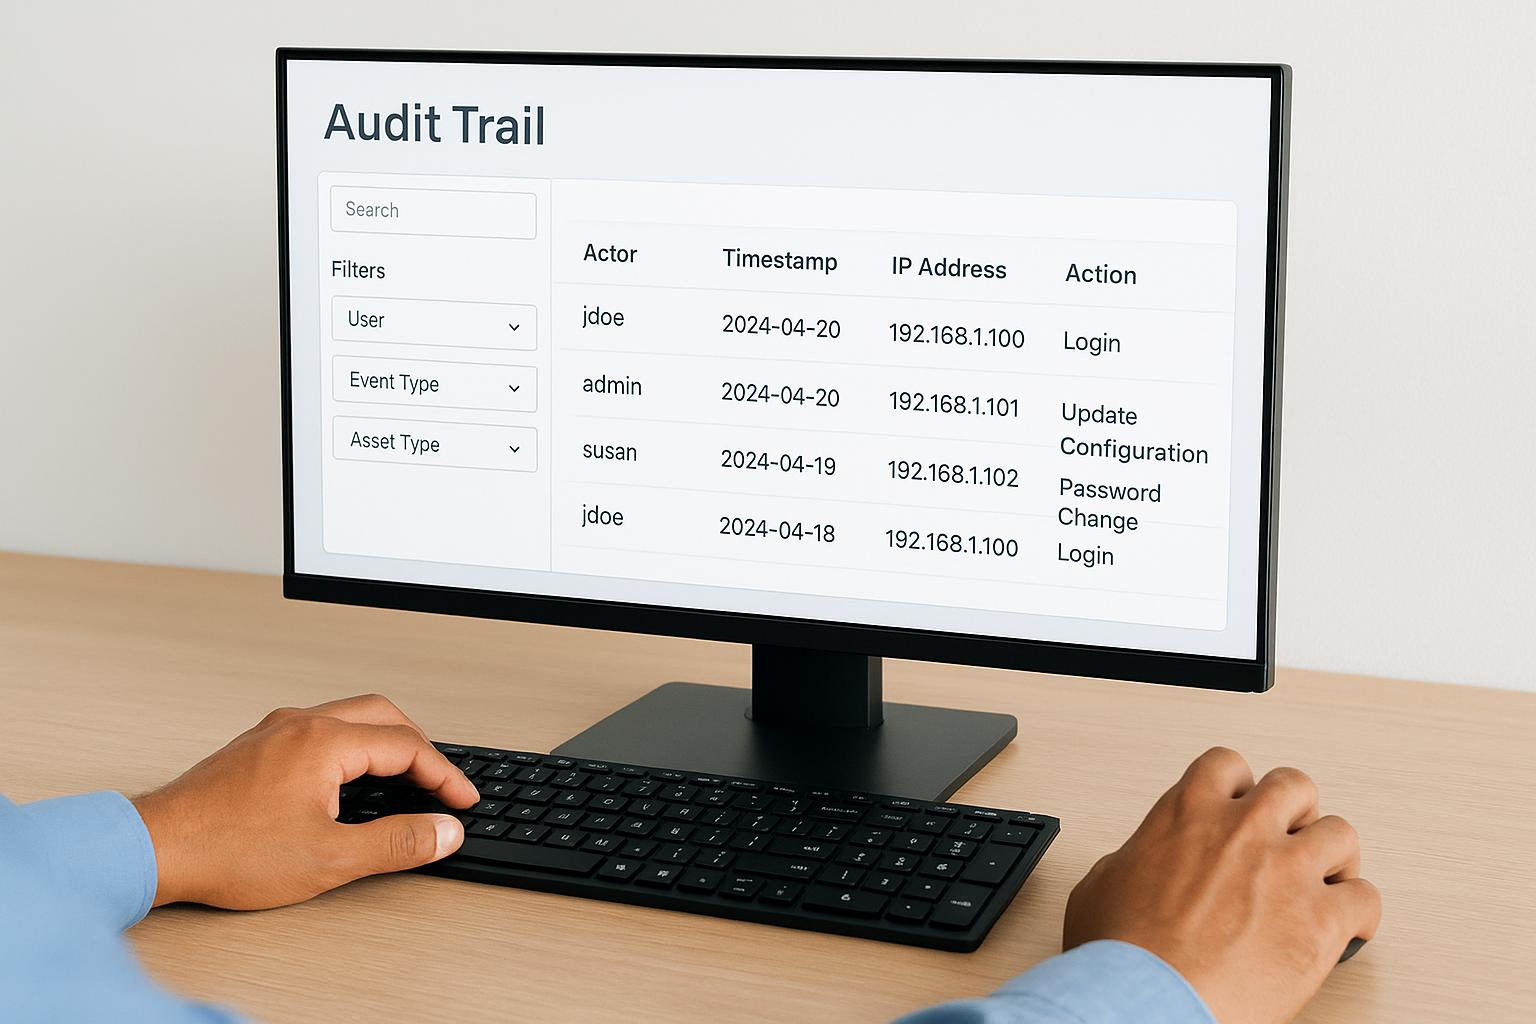
Datadog stores audit events separately from your log index, so your audit records stay intact even if you modify your standard log pipelines.
Each event entry shows the actor, timestamp, and IP address alongside the specific action taken, giving your security team the full context they need to determine whether an event represents normal behavior or something worth investigating through your datadog audit logs workflow.
How to stream and ingest audit logs into Datadog
Datadog's Audit Trail captures internal account activity, but your security picture isn't complete until you also pull in log data from external systems. Datadog supports two directions of data flow: streaming your Datadog audit events out to storage or SIEM platforms, and ingesting audit logs from cloud providers and third-party services into Datadog for unified analysis.
Streaming Datadog audit events outward
You can forward Datadog audit events to Amazon S3 or Google Cloud Storage for long-term retention beyond the 90-day in-platform limit. This matters for compliance frameworks that require multi-year log retention, where keeping records only inside Datadog isn't sufficient. You configure the forwarding destination directly in the Audit Trail settings, and Datadog pushes events in structured JSON format automatically.
Sending audit events to a dedicated storage bucket gives your compliance team an independent, tamper-resistant archive that auditors can access without touching your Datadog account directly.
Ingesting external audit logs into Datadog
Your cloud infrastructure generates its own audit trails, including AWS CloudTrail, Google Cloud Audit Logs, and Azure Activity Logs. You pull those into Datadog using native integrations or the Datadog API, which lets your security team correlate cloud-level activity with Datadog account events in a single interface.
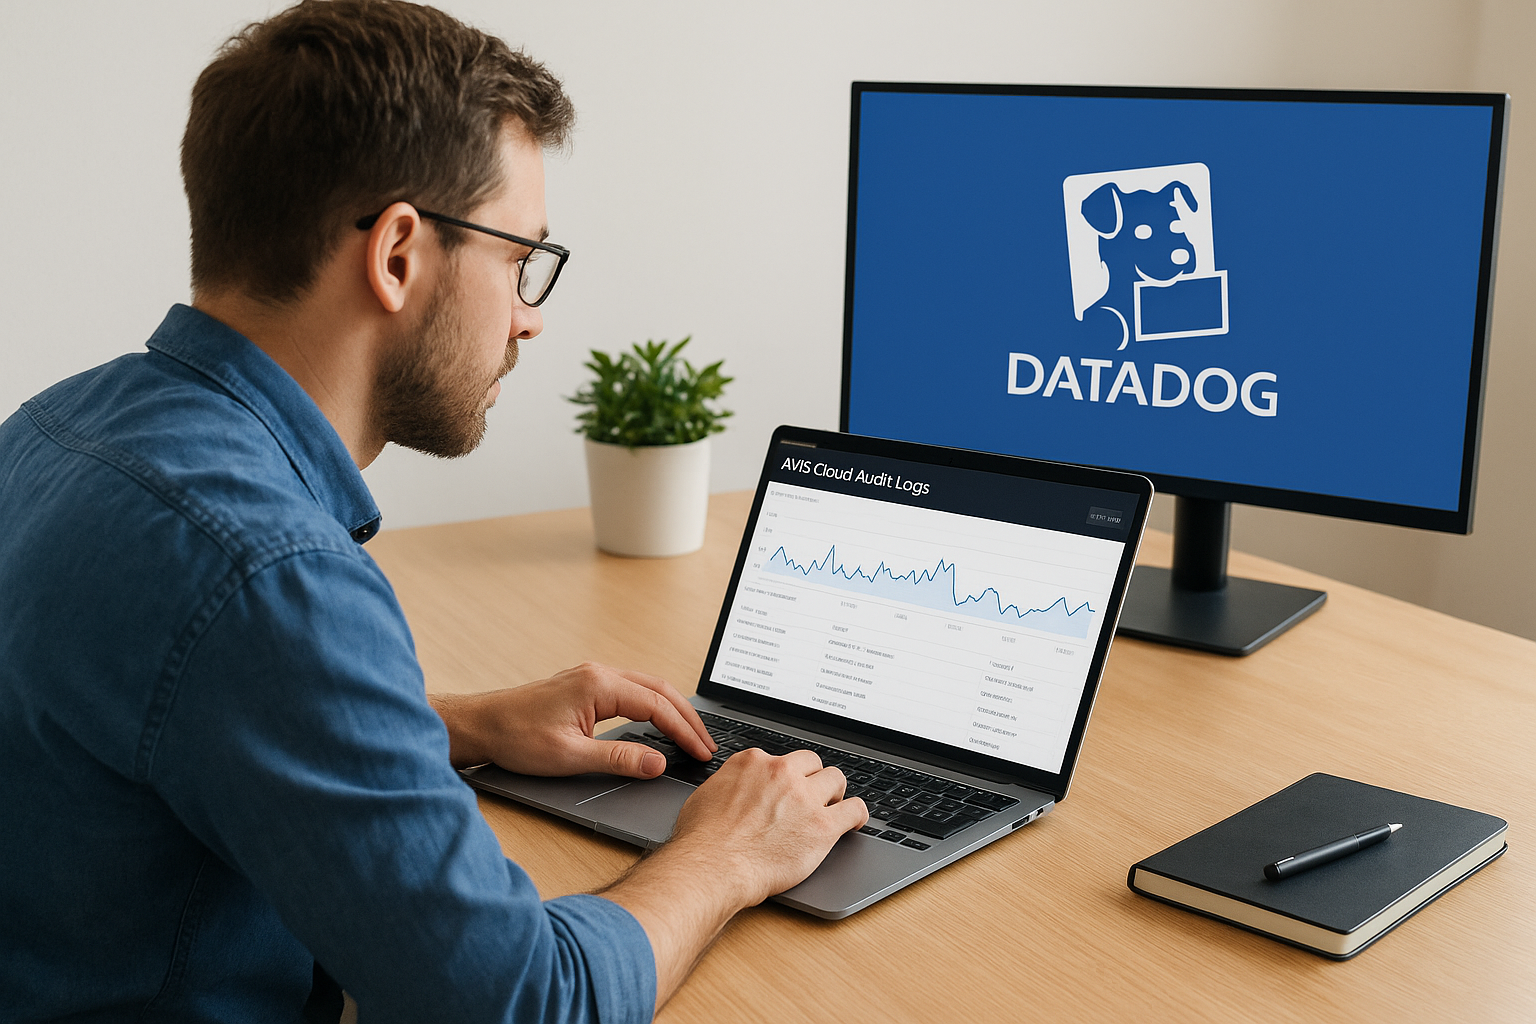
Working with datadog audit logs alongside external sources gives you a complete cross-platform timeline, which makes incident investigations faster and compliance reporting more straightforward.
How to analyze audit events and respond fast
Once your audit events are flowing into Datadog, the next step is making them actionable. Raw log data only helps you if you can query it quickly and surface the right signals before a small anomaly becomes a real problem.
Building queries and dashboards for audit data
The Audit Trail explorer supports attribute-based filtering, which lets you narrow results by user, event type, asset, and time range without writing custom query syntax. You can pin filtered views as saved searches, so your security team pulls up a pre-built view instead of reconstructing the same filter every investigation.
Combining your datadog audit logs with standard log dashboards lets you build a unified security view. For example, you can place an audit event widget alongside an infrastructure health panel, giving on-call engineers both operational context and access-level history in one screen during an incident.
Setting up alerts on critical events
Datadog lets you create monitors directly from audit event queries, which means you can alert on specific actions like API key creation, role changes, or failed login attempts the moment they happen.
An alert that fires within seconds of an unauthorized configuration change gives your team time to investigate and revert before any downstream impact spreads.
Pairing these monitors with notification channels like PagerDuty or Slack closes the loop between detection and response, keeping your reaction time measured in minutes rather than hours.

Next steps
Datadog audit logs give your team a concrete, queryable record of every significant action inside your Datadog account and across connected external systems. You've now seen how Audit Trail captures user and configuration activity, how to stream those events to long-term storage, how to ingest cloud audit logs for cross-platform visibility, and how to build monitors that cut your response time significantly.
The next move is putting this into practice inside your own environment. Enable Audit Trail in your organization settings, connect your cloud provider integrations, and build at least one monitor around a high-priority event type like API key creation or role changes. Start narrow and expand your coverage as your team builds confidence with the data.
For healthcare teams managing HIPAA-compliant infrastructure, compliance controls need to extend beyond your monitoring layer. If your application integration layer needs the same rigor, explore SoFaaS for managed SMART on FHIR integration built with audit logging and encryption included.
The Future of Patient Logistics
Exploring the future of all things related to patient logistics, technology and how AI is going to re-shape the way we deliver care.
Thank you! Your submission has been received!
Oops! Something went wrong while submitting the form.